Introduction and background
What is the Administration Distribution Cycle?
Administration Distribution Cycle is a cost allocation process for the Administration and HR department to identify, accumulate, and assign related expenditures to cost objects. The process undertakes the following three steps:
- Identify the cost objects in a company (i.e. departments/products etc.…);
- Identify the expenses incurred by the respective cost objects (materials/marketing etc.…); and
- Assign the respective expenses to the cost objects based on a specified criterion.
It is essential to identify the different departments in an organization for multiple reasons (including but not limited to):
- Budgeting and processing;
- Cost and budget allocation;
- People and change management, etc.
Problem Statement:
The client rents office spaces for its employees across the country (PAN India level) incurring costs of an extensive magnitude, making the process of maintaining these costs manually both difficult and expensive.
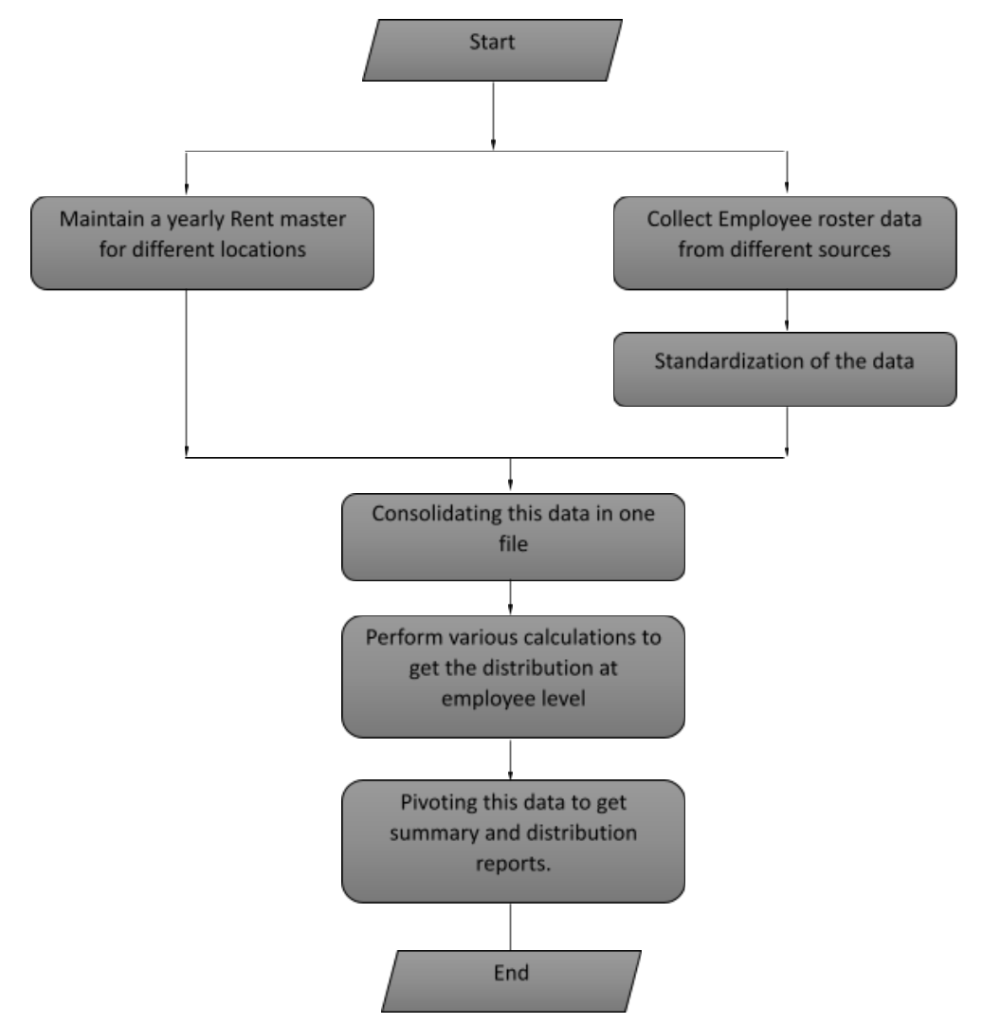
The current system of the company involves doing this manually by collecting the data from different sources and formulating the distribution reports and budget summary for the stakeholders, which can be used to finalize the budget for the future. This was a tedious process due to the amount of data used for calculations and the time consumed in completion, as it was done on a PAN India level. Also, manual working had the risks of error eventually projecting false reports.
Before SheetKraft:
- The process in place at the client was undertaken manually – these included processes to collect data from multiple different sources across the country and formulate the distribution reports and budget summaries for the stakeholders.
- The tasks undertaken by the teams at the client were tedious, repetitive, time-consuming and moreover exposed to the risk of manual error.
- Various formatting transformations, formulating calculation formulas etc. exposed the data to the risk of manual error.
Based on this exercise, the following three outputs are achieved and shared with the respective stakeholders to facilitate decision making:
- A source data for all rental expenses for offices across the country;
- A summary report is generated to calculate any absolute differences in the rental expense across the country (gains/losses); and
- A comparison report of profit and cost centres on a percentage basis across the country.
- Following is the flowchart of how the manual process takes out:-
After SheetKraft:
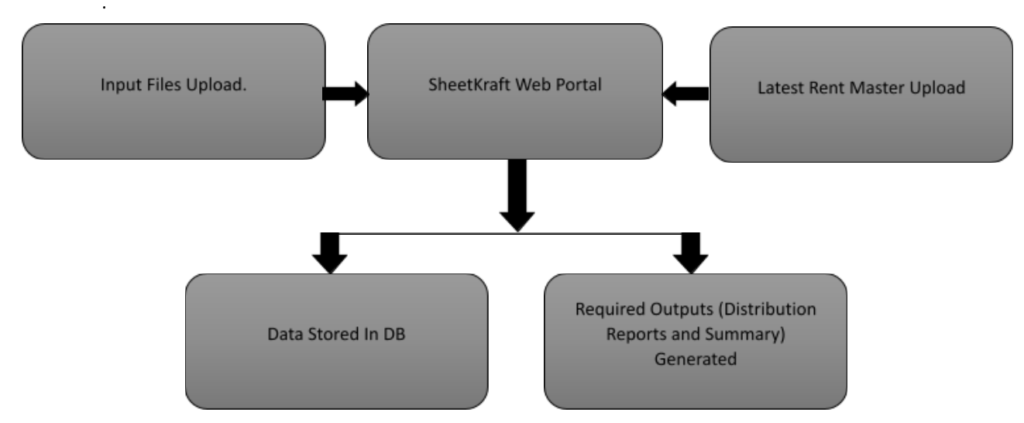
- SheetKraft was used to extract all the data from the different identified sources, transform and consolidate this data using appropriate functions and formulas to calculate required parameters.
- Further, a master database was created to store the rent information which could further be sliced and diced to use as required for budgeting and/or reporting.
- Certain inbuilt validations and filters allowed mitigation of the inherent risk of manual error and inconsistencies within the data.
- In addition, a separate functionality was built for the client allowing them to retrieve information/reports for previous months at the click of a button – eliminating the tedious task of performing the complete process time and again for specifically required months.
Key takeaways:
- The client is now able to achieve the results and required reports in a matter of minutes.
- A dedicated skilled personnel requirement has been eliminated and people with the authorized credentials (clearance) in the company can perform this activity.
- A constant rechecking aspect of the process has been eliminated and the reports generated are 100% accurate.
| Before SheetKraft | After SheetKraft | |
| Time Span | One week | 1-2 minutes |
| Accuracy | Error-prone due to Manual working | 100% accurate and automated |
| Skilled Labour | Dedicated | Any authorized personnel |
| Frequency | Monthly | Monthly |

